
Weather data
Databases - Lesson 2
Objectives
- To select appropriate data to add to a database
- To create a collaborative class database
- To search and sort a database
Lesson Resources
Lesson 1 - What is a database?
Lesson 2 - Weather data
Lesson 3 - Building and searching a database
Lesson 4 - Turning data into graphs
Lesson 5 - Collecting data with online forms
Lesson 6 - Analysing results and presenting findings
Please note
The data collection in this lesson is linked to weather and countries around the world. However, it can be adapted for plenty of other topics as well, if you prefer to link it to your theme in school. You will need a theme that provides around 6/7 data categories with unambiguous factual data. It’s also useful to find child friendly websites that the students can use to collect the data. Sporting stats also work well, especially linking to big events like Olympics, World Cups or other competitions.
![]()
Before the lesson, open the resource ‘Weather around the World - MASTER COPY’ and make your own copy of the spreadsheet by going to File > Make a copy > and rename the file and add your students names to the first column. Share this with your class just before the lesson (just like in the last lesson).
![]()
If your school uses Microsoft 365 for Education, open the same file: Weather around the World - MASTER COPY’ and go to 'File' and choose 'Download as' > 'Microsoft Excel'. Then upload the Excel spreadsheet to your One Drive or Sharepoint account and share it with your class.
Introduction
Begin by recapping the previous lesson. Ask the students:
- What can you remember about databases from last lesson?
- What is a field?
- What is a record?
- Where might you find a database being used?
- What sort of data might be in our school database?
Remind them of the ‘My Favourite’ exercise that we completed last week, it was fairly easy as all the answers were about us, so we just had to think of our own answer. This week we are going to be creating another database, but this time we will need to do some research first to collect the data, which will be done collaboratively.
Main task
Open your copy of ‘Weather around the world’ spreadsheet (or your own subject version if you've chosen something other than weather) and introduce it to the students. Each student will take a line of the spreadsheet, like with ‘My Favourite’. Each line contains the name of a country, in this exercise we will be researching what the weather is like in those countries.
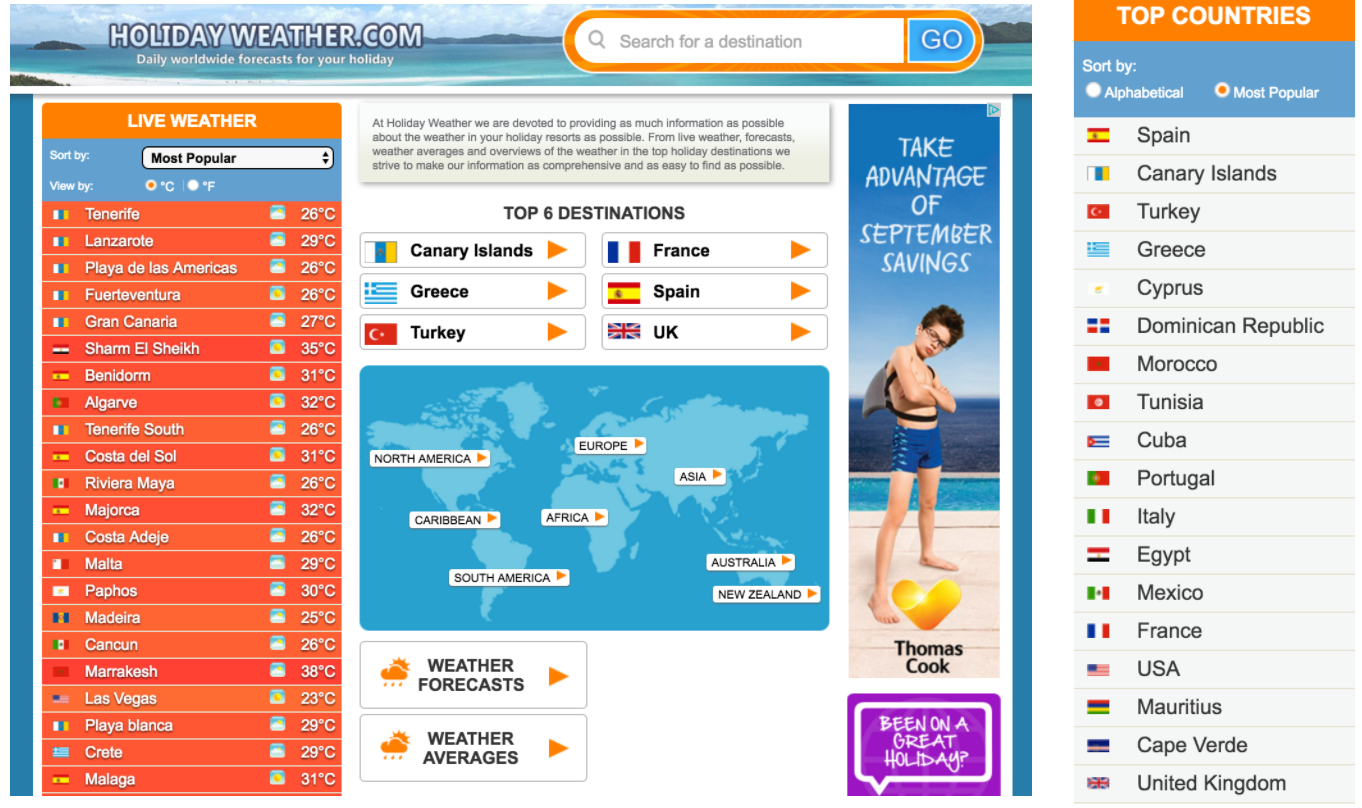
www.holiday-weather.com is a great website for finding out about weather data for all these countries.
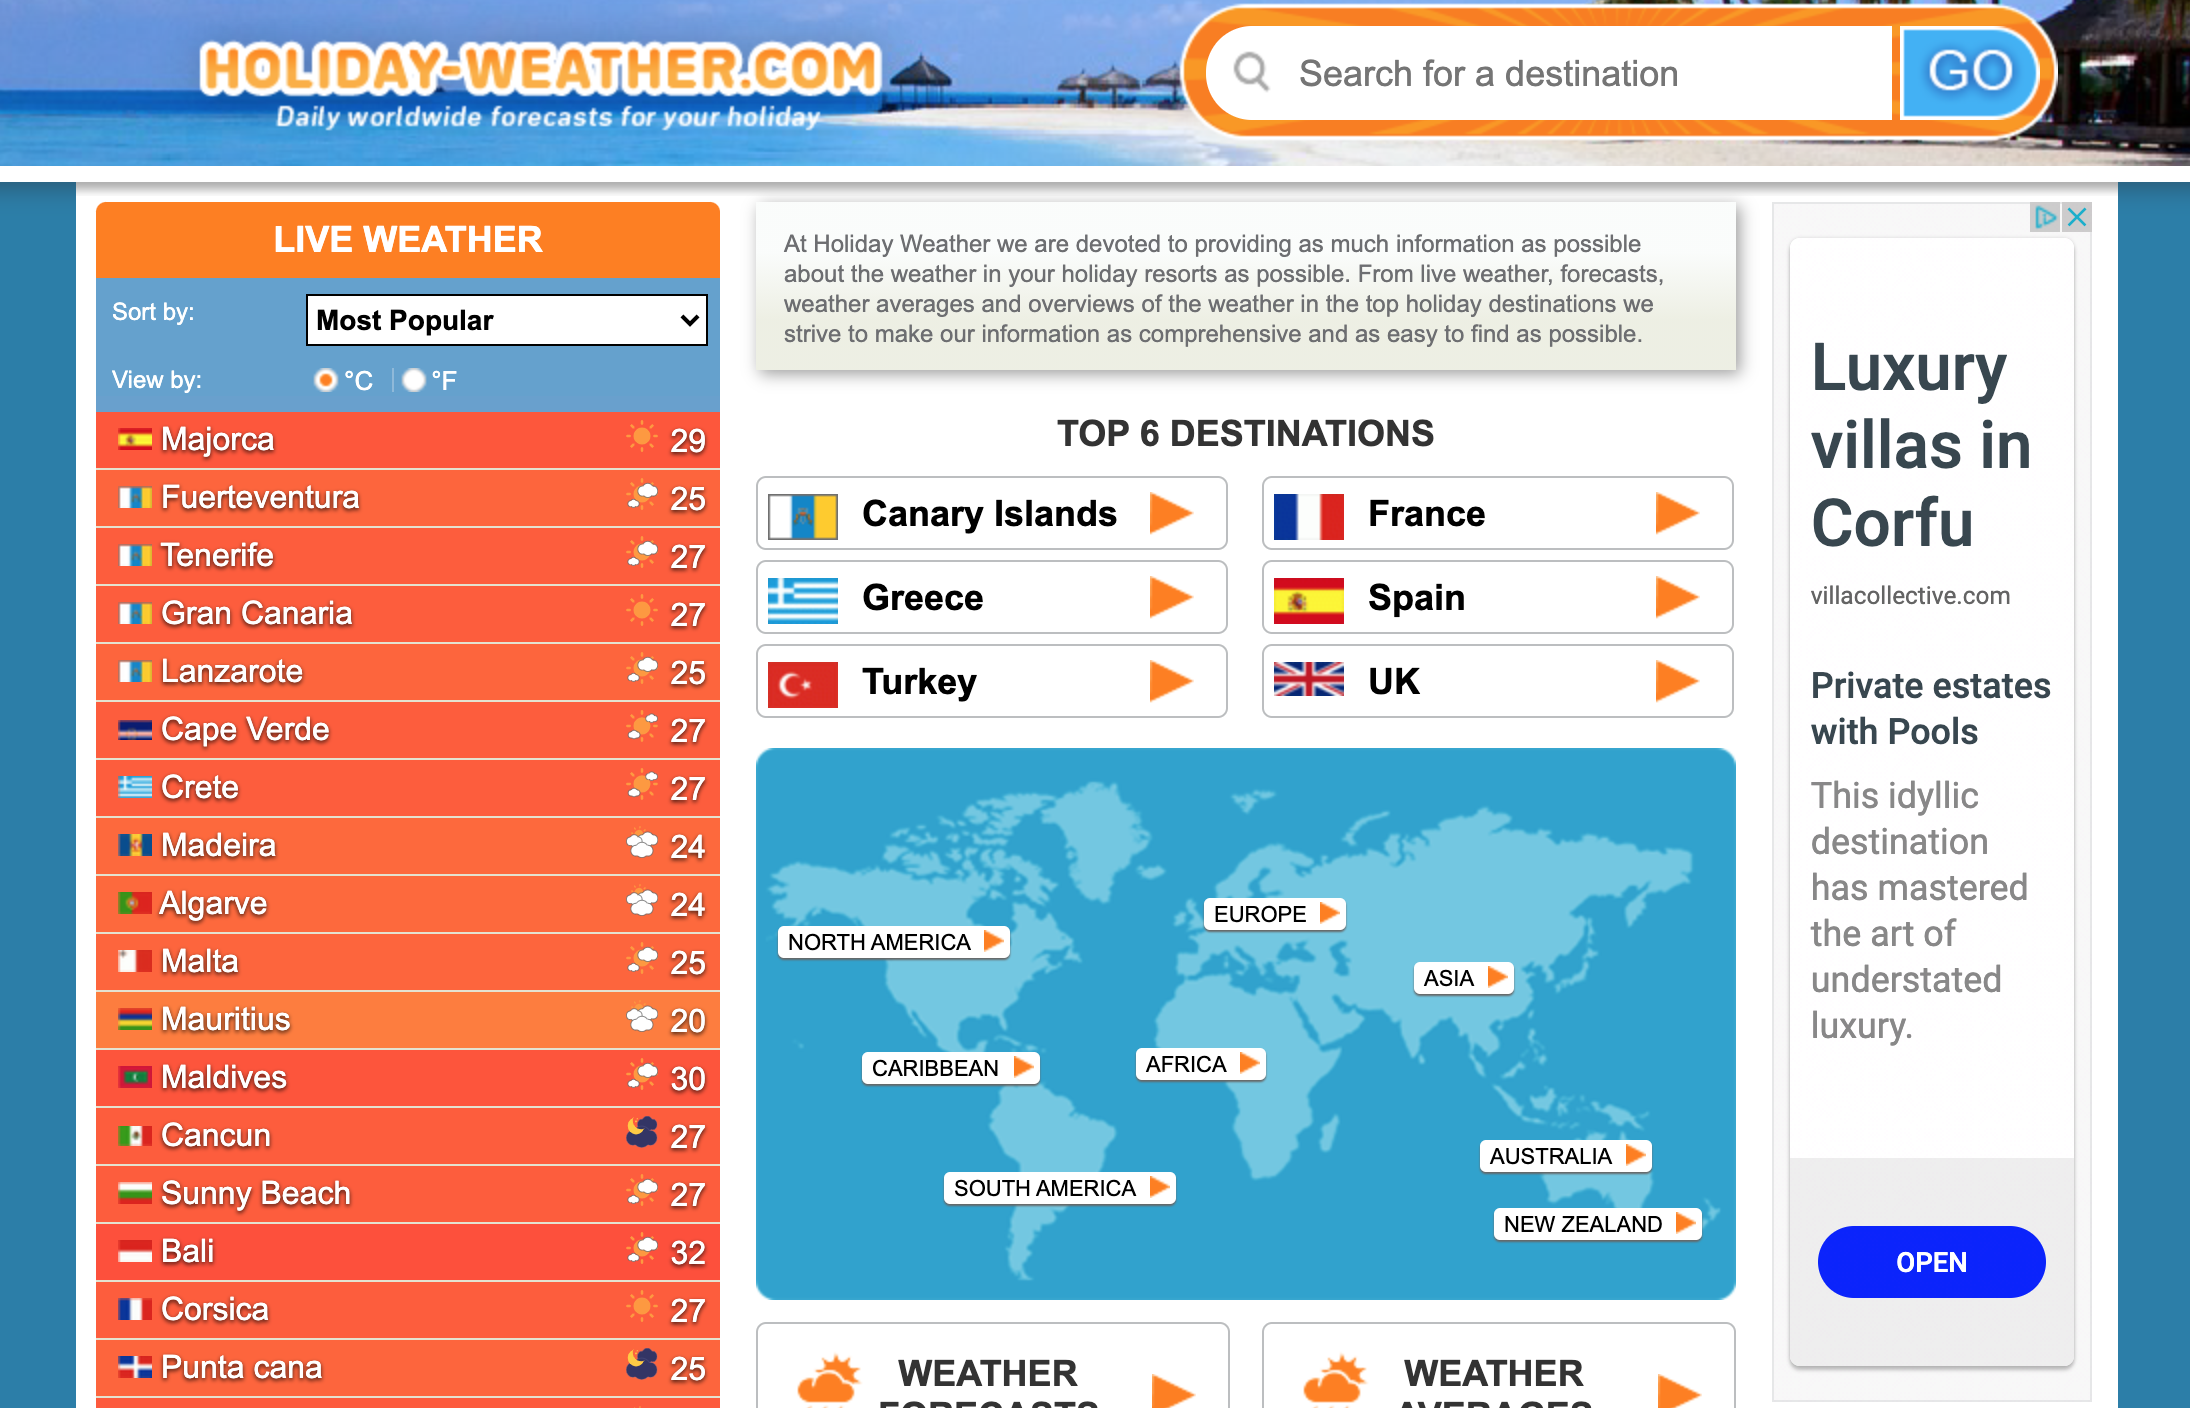
You can use the countries provided (which were the 30 most popular countries searched on the website) or you can choose/add your own. The country names on the spreadsheet are hyperlinked to the correct page on the website which should make it easy for the students to get to the right page for their data.
They need to find out:
- Average temperature in January (℃)
- Average temperature in July (℃)
- Hottest month of the year
- Average rainfall in January (mm)
- Average rainfall in July (mm)
- Average Daily hours of sunshine in January
- Average Daily hours of sunshine in July
As they click on their country name it should take them to a page like this.
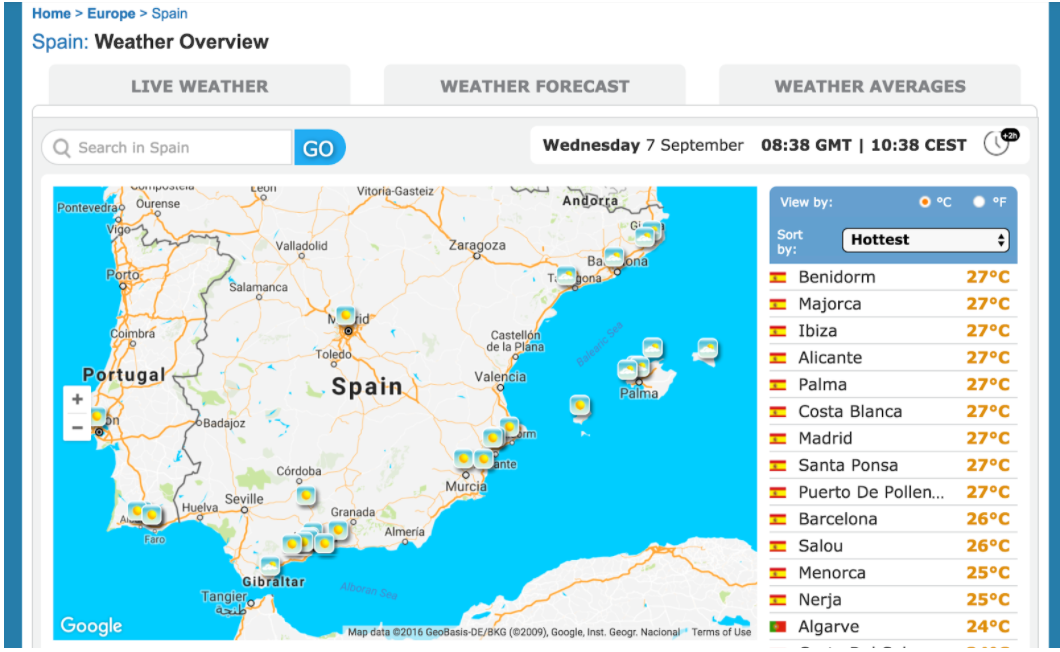
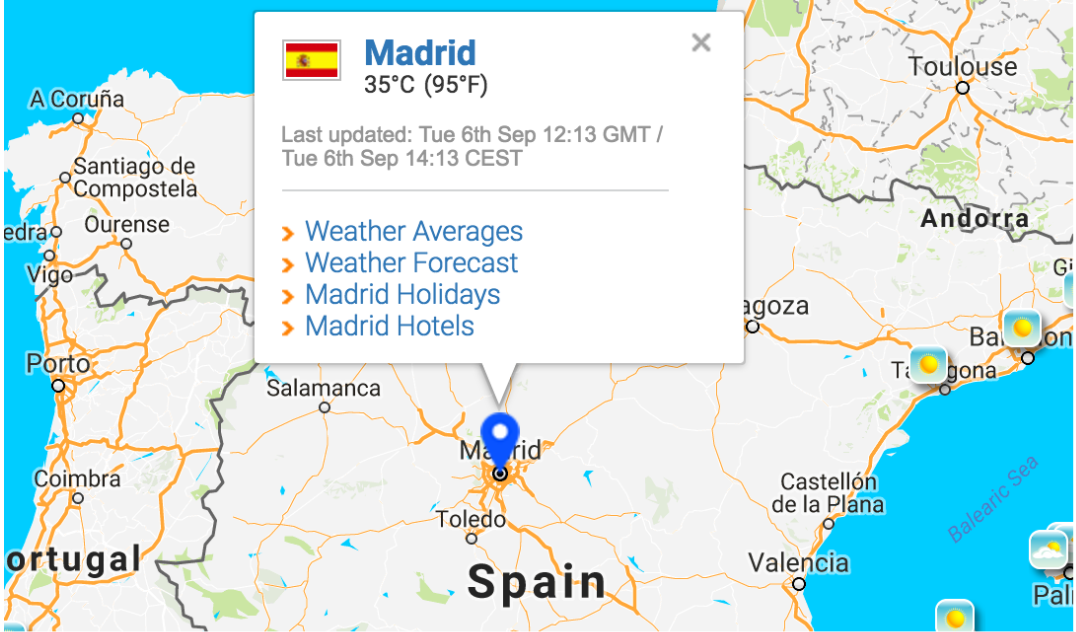
If they click on a (fairly central) city from the list on the right a box will pop up on the map. Click on ‘Weather averages’.
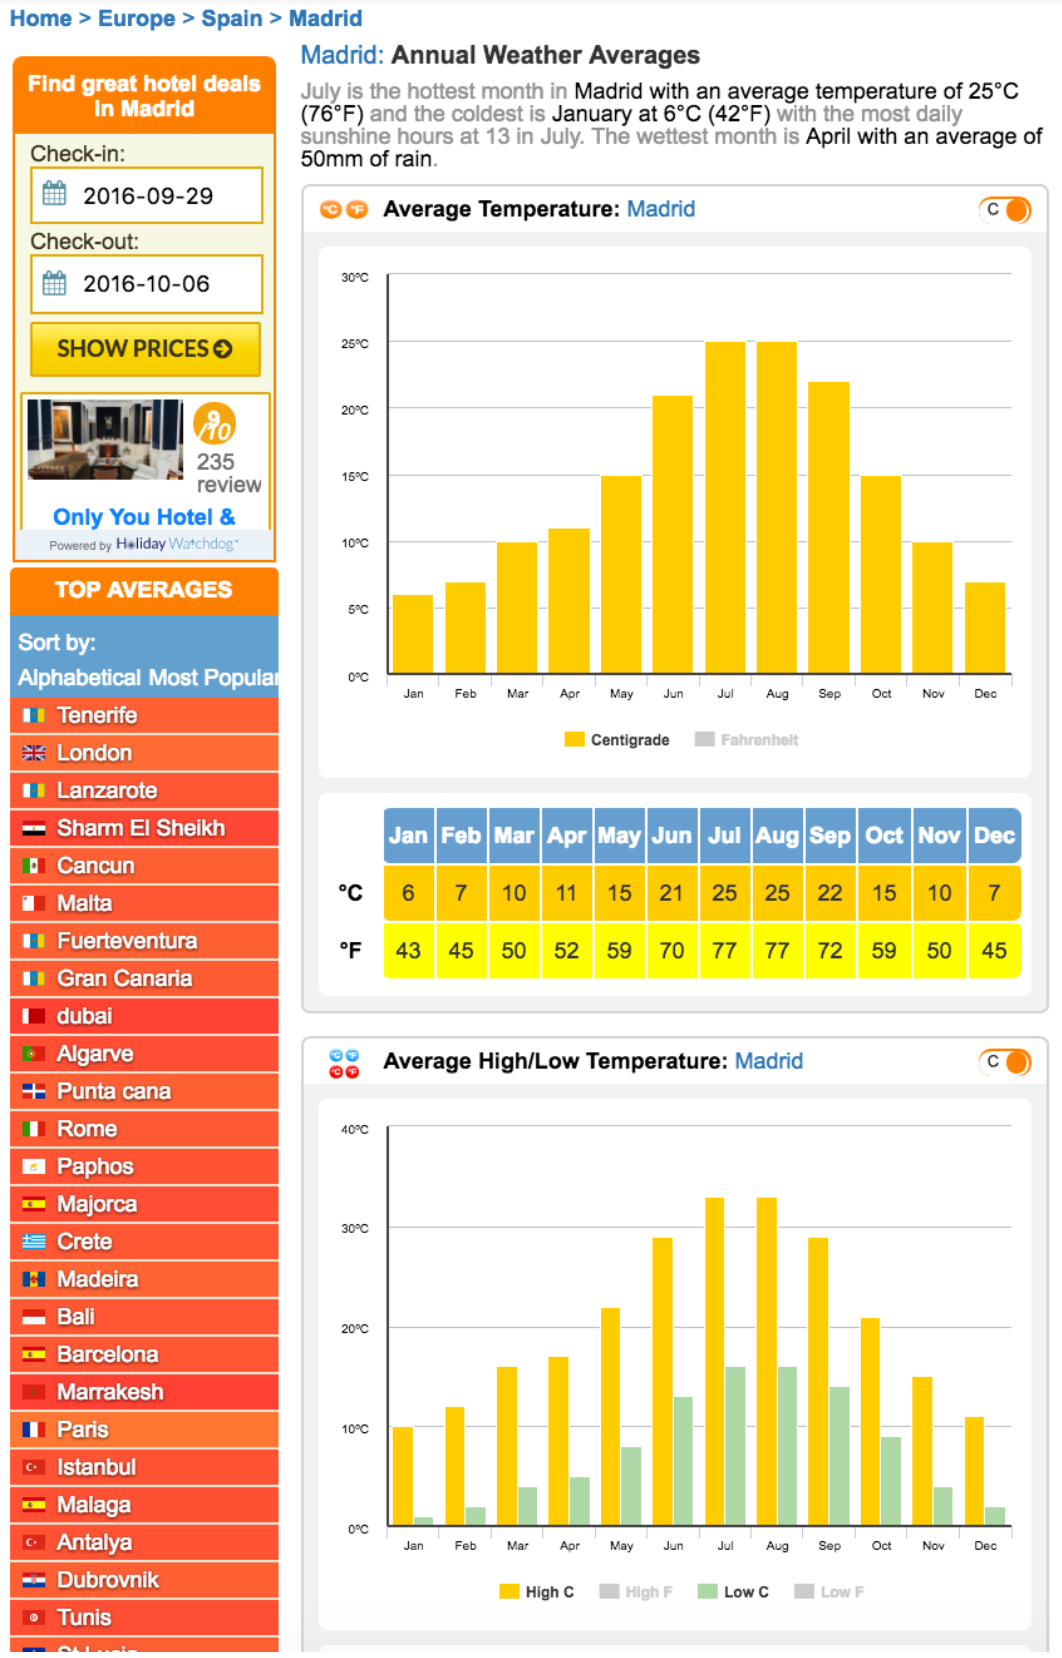
This will then take them to the data page they need, which has everything in graph and table formats so should be accessible to most children.
You can also get to any country’s data from the homepage by using the search box at the top of the page or by clicking ‘Weather averages’ at the bottom of the screen and then scrolling down to the list of top countries on the left of the screen. From here you can search alphabetically or by most popular.
Demonstrate to the students that they will need to work between two different tabs in their web browser, finding the data from the website, then switching back to the spreadsheet and carefully entering it into the database in the correct place. Remind them about being very careful to stick to their own line and only add data as numbers (no units are required as they are all shown in the column titles).
Once you have shared the spreadsheet with them they should be able to access it from the notification in the email inbox or from their Drive in ‘Shared with me’.
Give them time to complete their sections of the database. When complete they can also search for an images of their country’s flag and save it into their My Documents folder-
Recap safe searching, appropriate search terms to use and good image searching - not saving thumbnails, deciding on the right size image, the correct aspect (landscape needed for this), where to save things.
If they still have time available, they can choose another country of their own that hasn’t already been researched by anyone and create a new row for themselves at the bottom of the database. They can then find their new country on the weather website independently and add the extra data into each column for that country. You may want to assist them with this part initially to ensure they are working on an empty row on the spreadsheet!
Plenary
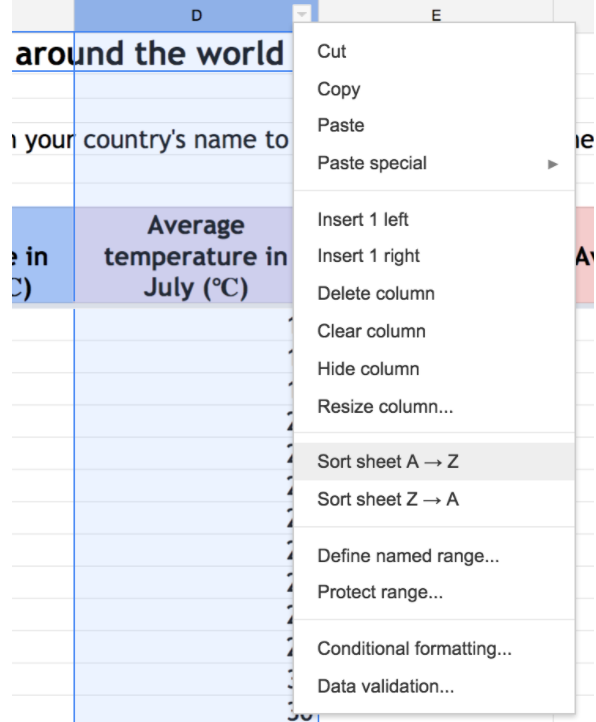
Get the class back together to analyse at some of the data. Which country has the highest average temperature in July? What could we do to make this easier to answer? Sorting it would make it easier to analyse the data. We can sort the data in our columns by highlighting the column and clicking the small drop down box in the column letter header and then choosing Sort sheet A - Z. This will also sort numerical data from smallest to largest.
What other facts can you tell me about just this field (average temperature in July)?
They might suggest the coldest country, the countries that have the same average temperatures, the region or continent that appears to be the hottest, the range from coldest to hottest etc.
Explain that in our next lessons we are going to transfer our data into other programs to make different kinds of database.