
Dig into the data
Micro:bit Mastery - Lesson 2
Objectives
- Understand inputs and outputs and give a variety of examples of how they are used.
- Design, write and debug code to collect accurate walking data.
- Collect, save and analyse data from a micro:bit.
Lesson Resources
- Lesson Slides
- BBC micro:bits (minimum 1:2 students)
- micro USB cables to connect micro:bits to computers
- 1 computer per micro:bit
- micro:bit Next Gen accessories for turning your micro:bit into a wearable device (or some thick rubber bands)
Lesson 1 - Conditions, variable and random outputs
Lesson 2 - Dig into the data
Lesson 3 - AI Machine Learning
Lesson 4 - Radio coded messages
Lesson 5 - More secure messaging
Lesson 6 - A smart light switch
Before you start
Before you begin, please read these important notes:
- This unit of work was created and added to our scheme in autumn 2025.
- It has been designed to follow on from our unit of work: Getting Started with the BBC micro:bit, which has been updated and moved to the Year 4 section in our scheme of work.
- If your students are new to a BBC micro:bit, we would recommend beginning with the ‘Getting Started’ unit, instead of these lesson.
- If your class have covered that unit already, or are quite experienced with using a micro:bit, go ahead and dive in to this unit, and have fun!
Micro:bit classroom

We would recommend delivering your lessons using the micro:bit classroom feature on microbit.org. This is very simple to use and gives really useful classroom management options for your lesson, such as:
- being able to send code to your students,
- view and edit their code from your screen,
- freeze their screens when you need their attention
- download a report of the lesson, including images of their screens
- save the entire session and resume it at a later date
All without the hassle of having to create student accounts. No usernames and passwords are needed.
You can find out more and watch a introduction video at microbit.org/teach/teaching-tools
You can get started with a lesson at classroom.microbit.org
Introduction - the processor, inputs and outputs
Begin the session by recapping what should be previous learning on inputs and outputs and the 'brain' of a computer; the processor, which is key to the process of inputs and outputs working on any device.
Show this short video from the Micro:bit Educational Foundation.
(View on Youtube here: https://youtu.be/Y9tk07CzTAA?si=CjRFzNj0-PdiTgiL)
Ask the class to describe what they understand about the processor and correct any misconceptions.
Then follow up with this second video on inputs and outputs, from the Micro:bit Educational Foundation. (View on Youtube here: https://www.youtube.com/watch?v=NkoS2JXaBuM)
Use the diagram on slide 44 to recap the process or an input signal being sent to the processor, it checking its memory for code to tell it what to do in response to that input, and then an output being produced (or not, if the code is not there).
Every key press, mouse click, touch screen tap or sensor being triggered is simply an input signal to the processor that something has happened.
Outputs can be many things, but some common examples are graphics or text on a screen, sound from a speaker, physical movement through motors or things like a printer printing a page.
Use slides 45 - 47 to ask the class to identify the inputs and outputs on the micro:bit and then how to write code to make use of its many inputs (slides 48 and 49).
Introducing the pedometer project
Explain to the class that in this lesson they are going to program your micro:bit to become a pedometer (step counter).
Pedometers work by sensing the movement of your steps and counting them so, (ask the class)
Which of the micro:bit’s inputs could be useful here? Inputs such as the 'On shake' block detect movement as an input and would be perfect. This works because of the micro:bit's accelerometer
Video from the Micro:bit Educational Foundation. View on Youtube here: https://www.youtube.com/watch?v=UT35ODxvmS0
How accurate are they?
The point of this project is to try and improve the accuracy of a pedometer we create. If you've ever used one, you may be aware that they can sometimes be over sensitive, leading to inaccurate counting of steps.
To help us make a more accurate pedometer, we're going to start by measuring exactly how much acceleration is generated when we walk normally.
The acceleration input block can measure 4 things with the micro:bit:
- acceleration on just the X axis
- acceleration on just the Y axis
- acceleration on just the Z axis
- overall acceleration in any direction (strength)
Open up your micro:bit classroom
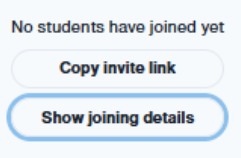
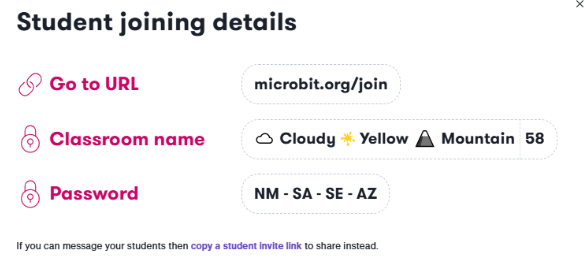
Direct the class to join your micro:bit classroom by displaying your joining information on the screen or by sharing this with them in another way, if needed. You can use the button below or click Invite on the micro:bit classroom teacher screen.
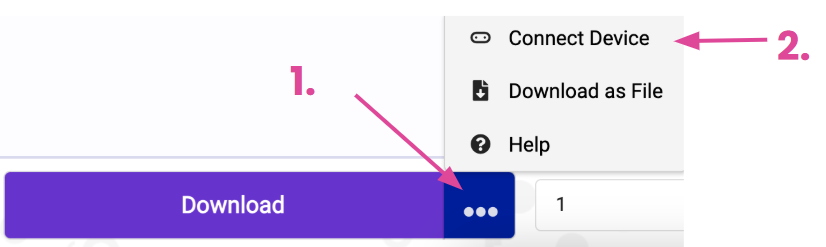
Once they have joined the class, they need to connect their micro:bit to their device browser by clicking the 3 dots next to the download button in the MakeCode editor, then select Connect Device and following the on-screen instructions.
Measuring acceleration
To make a more sensitive pedometer that is personalised for each student, we need to know how much acceleration is measured when they take normal steps. When we know this, we can program our pedometer to only count movements of a similar force. Acceleration is measure with the unit of milli-g, which is 1/1000 of a g.
1g is as much acceleration as you get from Earth’s gravity. G-Force stands for Gravitational Force.
Ask the students to go to the Extensions section on the MakeCode editor. From here they can add the Data Logger blocks.

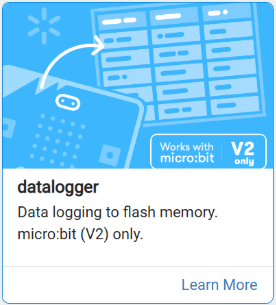
Once added, you'll see this new category of blocks available in the editor.

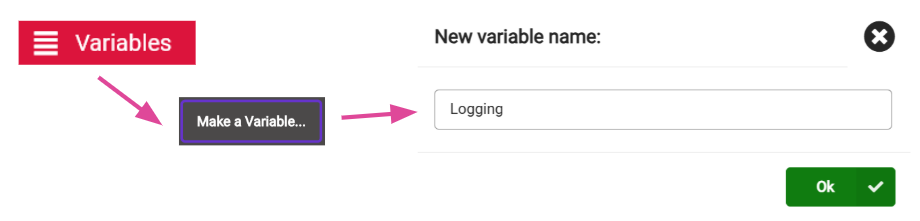
Next, we want to be able to turn the data logging on and off. To do that, first create a variable called 'logging'.
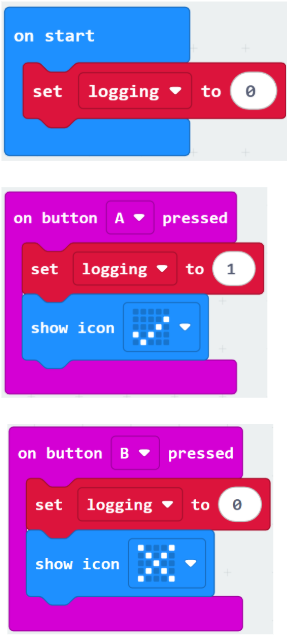
Three parts of code are required that all control this variable and turn data logging on (1) or off (0).
- When the program starts logging is set to 0.
- Pressing A sets logging to 1 and shows a tick icon to show the user that logging has started.
- Pressing B sets logging to 0 and shows a cross icon to show the user that logging has stopped.
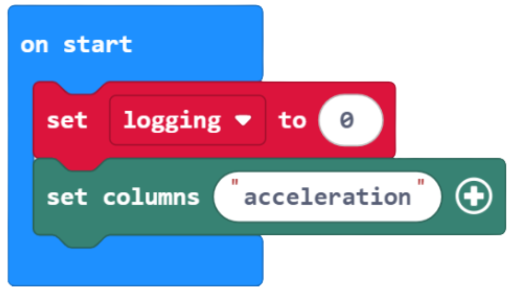
Now we need to add the actual data collection blocks. From the Data Logger section, add the ‘set columns’ block to your ‘on start block’.
Type ‘acceleration’ in the block. This just gives a title to the data we’ll collect.
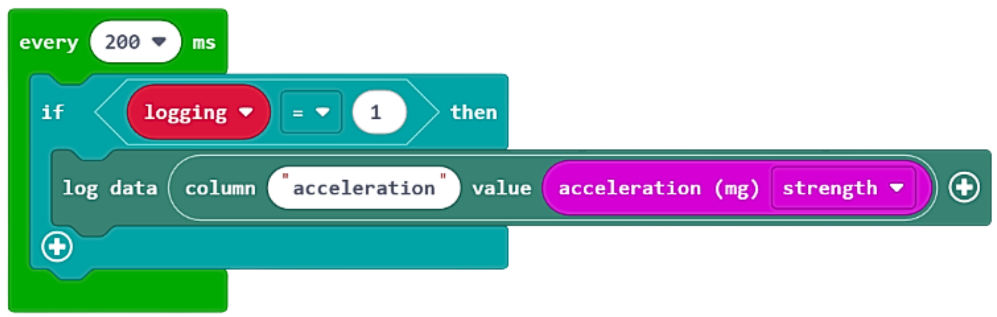
Finally, build this new code.
- The code repeats every 200 milliseconds (5 times per second)
- When the logging variable has been set to 1 (A pressed) the accelerometer begins to collect data and save it in our acceleration column.
Download all the code to your micro:bit.
Assembling your pedometer
If your school received the micro:bit next gen packs in 2025, you should have received an accessories pack which contains rubber micro:bit holders and velcro straps. These can be used to attach the micro:bit to your wrist or ankle. You'll also need a battery pack and batteries. This video shows how to put it all together. If you don't have these parts, you can tuck it all in your sock and/or secure it all with rubber bands.
Once its attached to the ankle, ask the students to collect their acceleration data. We are simply trying to collect data that demonstrates what their normal walking is like, so remind them to walk normally!
- Strap the micro:bit to your ankle.
- Press the A button to start the acceleration data logging.
- Walk at your normal speed for 10-20 seconds.
- Press the B button to stop the data logging.
Remove the micro:bit from your leg. DO NOT PRESS the A button again.
Viewing your acceleration data
When you have collected any kind of data with your microbit (in datalogging mode), you can then see the data in table and graph form.
Next plug your micro:bit back into your computer with your USB cable.
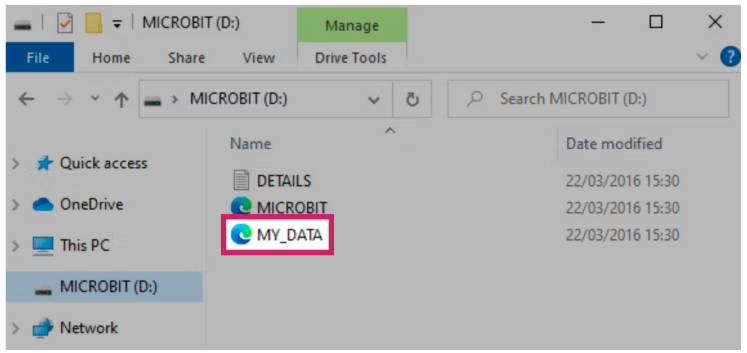
Open Files and to navigate to the micro:bit which will usually show as the D: Drive (Windows) or simply as Microbit on a Chromebook.
Look for the MY_DATA file. Double click it to open the data you collected in your browser.
You'll see the data you have collected appear in a table, showing time in one column and acceleration in the other.
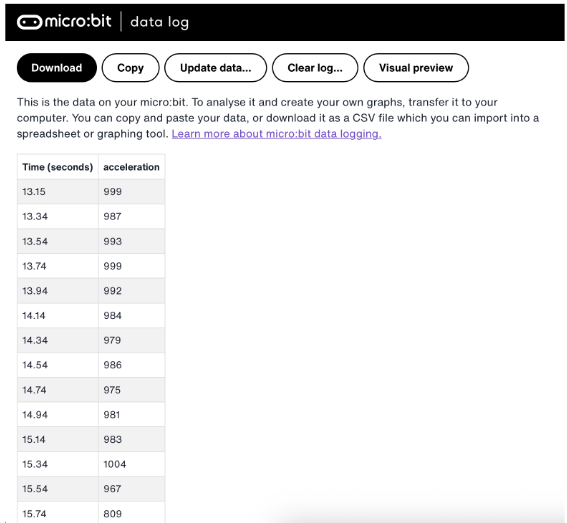
Click the Visual Preview button to see the data in line graph form, which is more useful. It shows acceleration on the Y axis and time on the X axis.
Ask the class - Can you spot when you were moving and when you were standing still? The flat parts of the line show no or very little acceleration and are therefore when they were still.
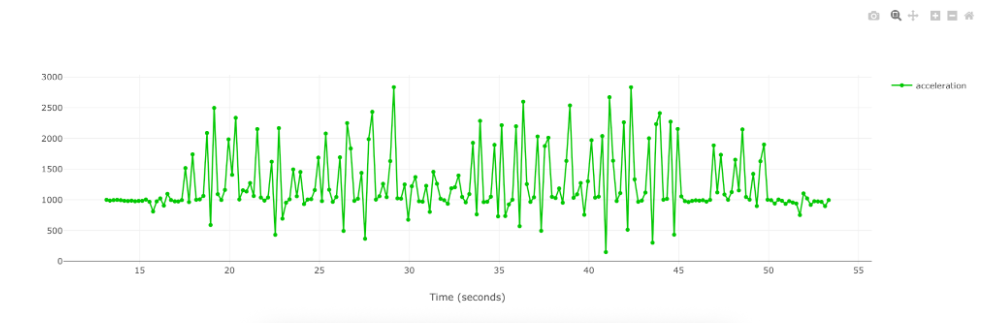
Every line peak is when the leg your micro:bit was attached to was moving. Ask - What was the highest amount of acceleration measured in your data?
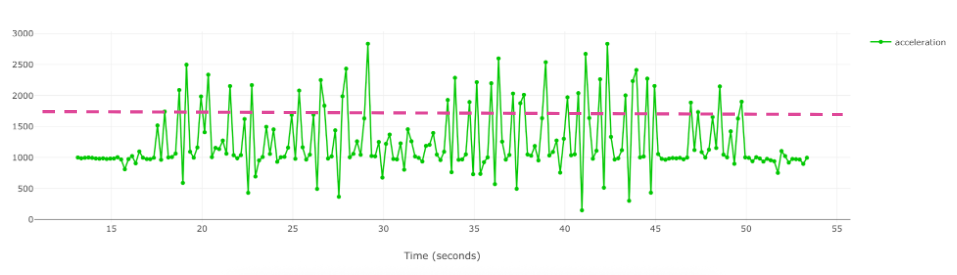
But we are trying to establish the amount of acceleration our micro:bit should use to recognise that we are walking.
- What number would you use for this threshold?
- Should it be the highest point on the graph?
No, we’re looking for a ‘best fit’. In this data, most steps seem to be around 1700 milli-g or more. We can use that as our threshold for our pedometer recognising a step. The acceleration measured has to be at least 1700 milli-g (students' own values may differ).
Coding your personalised pedometer
Ask the students to clear away any previous code or start a new project.
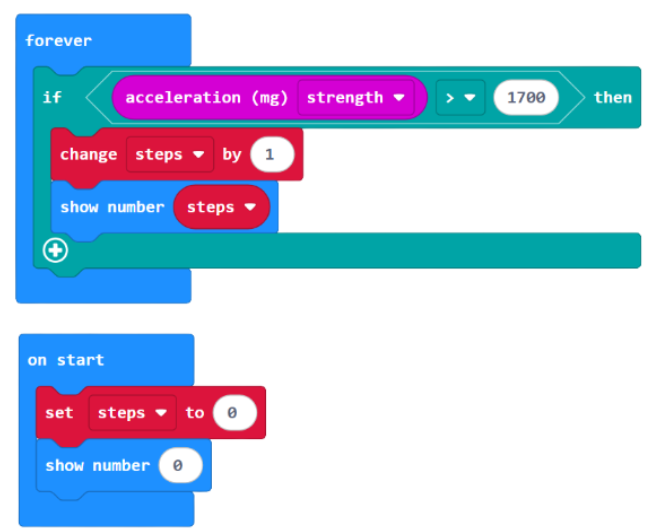
Here’s the pseudocode for our personalised pedometer:
- When the program starts the number of counted ‘steps’ should be set to 0
- The user should see this on the LEDs.
- Then, if the accelerometer measures more than your baseline reading (1700 milli-g in our example) then ‘steps’ should increase by 1
- The user should see the new number of steps each time it increases.
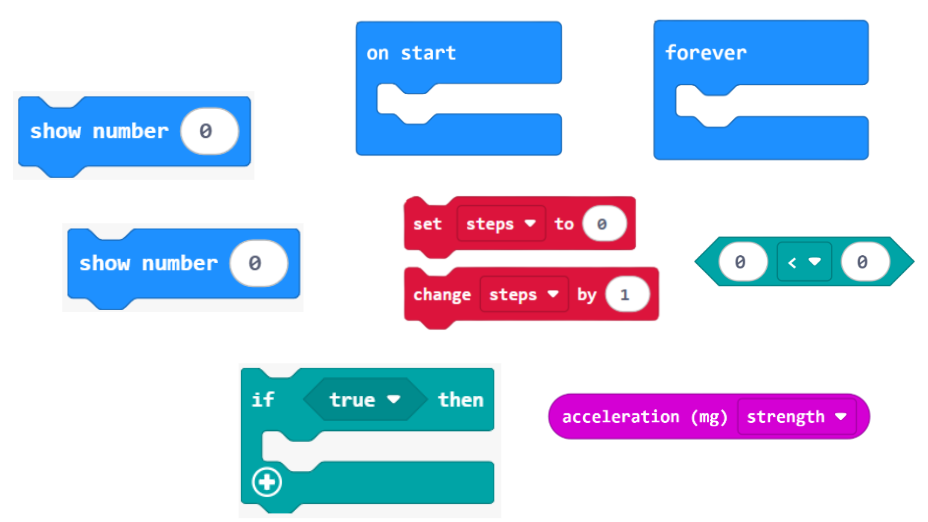
Ask the students to have a go at turning this into working code. There's some hints with the parts in bold, and if they need more than that, slide 73 show the bocks they'll need, disassembled.
Here's a solution.
Once the students have the code, download and test it out. Does it accurately measure your step count?
Extension challenges
If you have time, set the students these three challenges for improving the way the pedometer works even further.
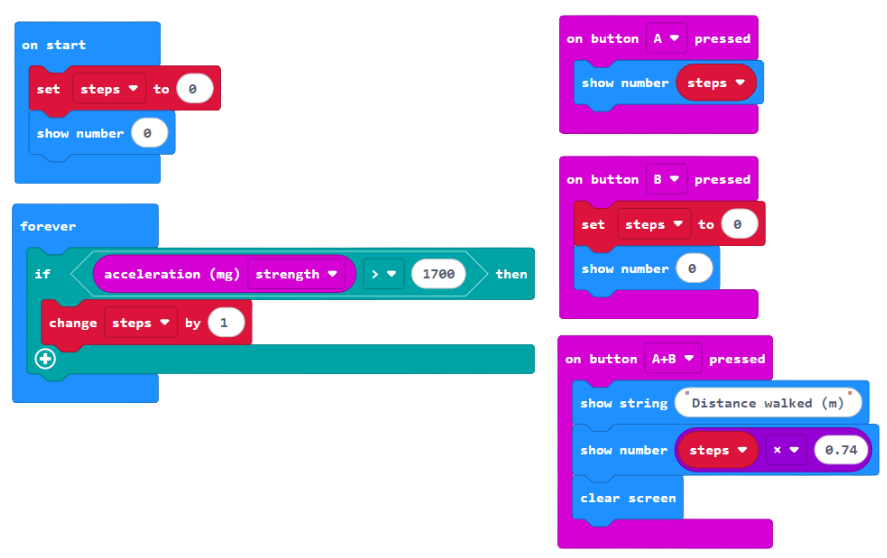
- Make your batteries last longer by changing the program so it only shows the number of steps when you press button A.
- Modify the program so button B sets the counter back to 0.
- Measure the length of your step and get micro:bit to multiply this by the number of steps to calculate the distance you’ve walked and show this when both buttons are pressed.
Some hint blocks are shown on slide 75.
Here are solutions. In the on button A+B pressed block 0.74 refers to an example stride length (74cm). You can add your own step length here. If it's written as a decimal 0.74 the distance walked will be displayed in metres.
To finish
Ask the students to talk to a partner about their success with the projects today. Consider these questions:
- How have you used inputs and outputs in this lesson?
- How did we collect data to improve our program?
- How have you used variables today?
- Can you think of any ways to improve your programs today?
Finish by revisiting the lesson objectives and asking students to consider their success and understanding. Invite any questions or requests for support if needed.